


Every year comes to an end eventually, and with it, a round up of all manner of statistics, from economic, to agricultural to those security-related. In this blog, we will highlight some of the SA Crime stats for 2018 that we think every resident should know, if only to be more aware of their surroundings. We will touch on some of the major crime categories, below…
Contact Crime Statistics
Firstly, we will look at Contact Crimes: these crimes include murder, attempted murder, sexual offences, common assault, robbery and more. In 2017, reported contact crimes tallied to a whopping 608,321 charges. We are fortunate to have seen a 1.1% decrease in contact crimes from 2017 to 2018, as the latter statistic peaked at 601,366 charges.
The country has a long way to go when it comes to contact crimes, but we can be grateful and hopeful that there is some improvement. Times of economic crisis are often characterised by violence and conflict. Hopefully the socioeconomic climate will stabilise in the coming year.
Contact-Related Crime Statistics
Secondly, we look at Contact-Related Crimes, which include arson, malicious damage to property, and so on. In 2017, contact-related crimes added up to 120,730 reported incidents. In 2018, contact-related crimes reach 115.361, showing a 4.4% decrease in a one-year period.
Statistics for Other Serious Crimes
The category of Other Serious Crimes refers to serious offences such as commercial crimes, shoplifting, hijackings, cash-in-transit heists and so forth. Whilst bank robberies showed an unbelievable increase from 2 in 2017 to 13 in 2018, other crimes in this category decreased steadily. A reported 469,276 crimes were reported in 2017, whilst those reported in 2018 reached only 438,113.
Crimes Detected by Police Action
A special mention must be made of crimes detected by police action. In this case, and increase in the number reported is mostly positive, as it does indicate more thorough police action and investigation. Active policing includes activities such as roadblocks and raids.
Categories of crime that fall into this statistic include illegal possession of firearms, driving under the influence, as well as use, possession or trade of illegal drugs.
In 2017, this category amounted to 390,021 charges, whilst 2018 statistics indicate 433,966, suggesting more active policing throughout South Africa. In essence, this stat increased by 11.3%.
Notable Increases in Crime Categories
Unfortunately, some categories of crime saw significant increases from 2017 to 2018. Murder as an individual statistic increased by around 7% from last year, coming in at well over 20,000 cases. According to BusinessTech, this means South Africa has an approximate 57 murders a day, at a rate of 35.7 people murdered per 100,00 population.
Cash-in-transit heists became the flavour of the year for criminals, with a 57% increase from 2017 to 2018. Reports from the SAPS indicate that this crime is trending upward. Criminals seek out weakness in organisations and their regular processes to exploit them and gain, illegally.
Disgustingly, the number of reports rapes in South Africa has increased to 30,035 cases in 2018, up about 1% from the previous year. This epidemic of abuse, particularly of women and children, needs to come to an end. A people can be measured by how they treat their ‘vulnerable’ members of society, and let’s just say that South Africa is failing that test and should be rightfully appalled at itself.
Notable Decreases in Crime Categories
Fortunately, there have been some notable decreases in certain crime statistics in the past 2017/2018 year. Common robbery came down 5% in 2018, from a previous tally of 53,418 cases in 2017 to a little over 50,000 in 2018.
Theft out of, or from, motor vehicles say a significant decrease of 6.5% from 2017 to 2018, decreasing from 138,172 cases to 129,174 over the year period.
Burglary at a residential premise came down from 246,654 cases in 2017 to 228,094 in 3018, indicating a 7.5% decrease. It does seem like burglaries are tending towards commercial properties in recent years.
Another pleasing decrease is that of arson, shrinking from 4,321 cases in 2017 to 3,869 cases in 2018. This is a little over a 10% decrease in arson throughout the year.
For a Full Presentation…
BusinessTech have put together a great presentation that illustrates the SA Crime Statistics for 2018. You can click here to gain a little more insight into the South African situation.
For a more secure home and of course, peace of mind, we invite you to take a look at some of our security solutions which can protect you and your home from intruders. Don’t become another statistic, take your home security into your own hands, contact us today.
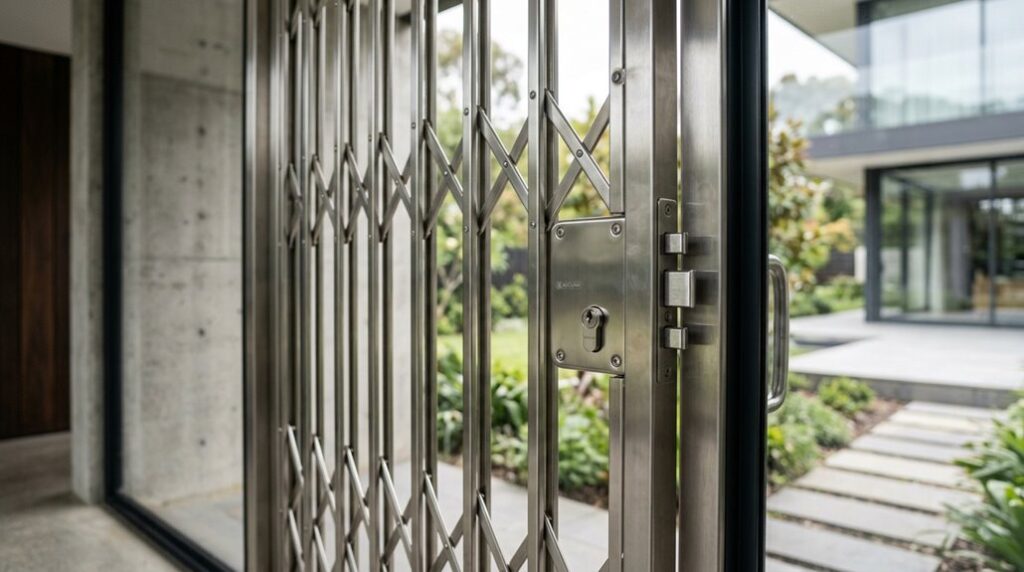
Loved our latest blog post? Take the next step in securing your home with Wonder Bars! Explore our range of services, including Cottage Pane Burglar Bars for timeless protection, Crystal-Clear Burglar Proofing for unobstructed views, and Swing Gates for Doors to add elegance to your entryways.
Looking for flexibility? Check out our Retractable Trellis Doors and Retractable Windows for adaptable security solutions. Protect against wildlife with our Vervet Monkey Proofing, or customise your security with Custom Door Security and Window Security Solutions.